AQUADA 170 m+
Summary
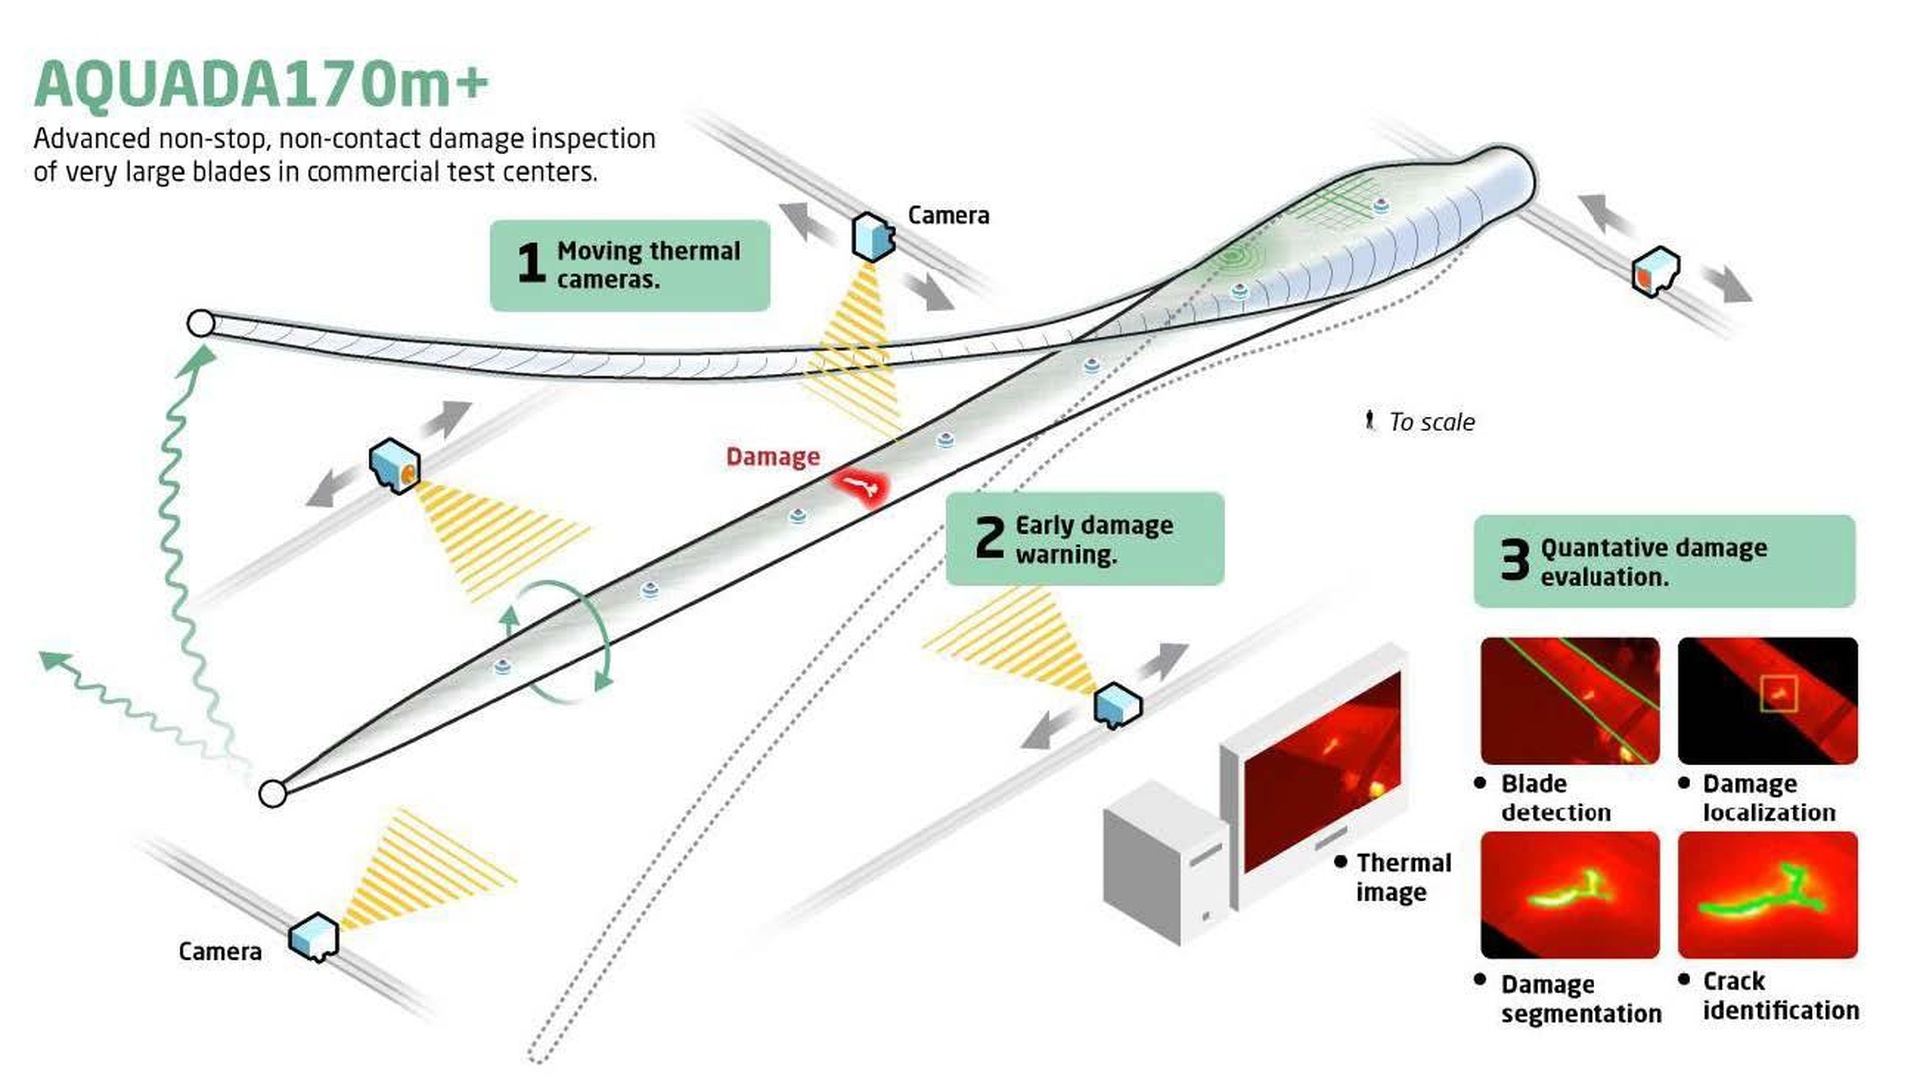
The project builds on the existing research outcome, named AQUADA, developed at DTU Wind based on thermography and computer vision technology, and further matures it toward a final solution for industrial application demonstrated at Blaest A/S. The complete solution consists of an integrated, adaptable thermal camera hardware platform and a modularized AI-driven software package with a robust client/end-user interface. AQUADA170m+ will be implemented at Blaest A/S and demonstrated on a 100m+ blade during fatigue testing, where hidden internal blade damage will be detected, tracked, and evaluated automatically and in near real-time without stopping the blade test. The AQUADA170m+ solution is also transferable and scalable, allowing fast deployment in other commercial blade test facilities in Denmark and worldwide. The project outcomes will change the current labor-intensive, time-consuming, and highly qualitative industrial practice in blade damage inspection in commercial blade test facilities.
Project images
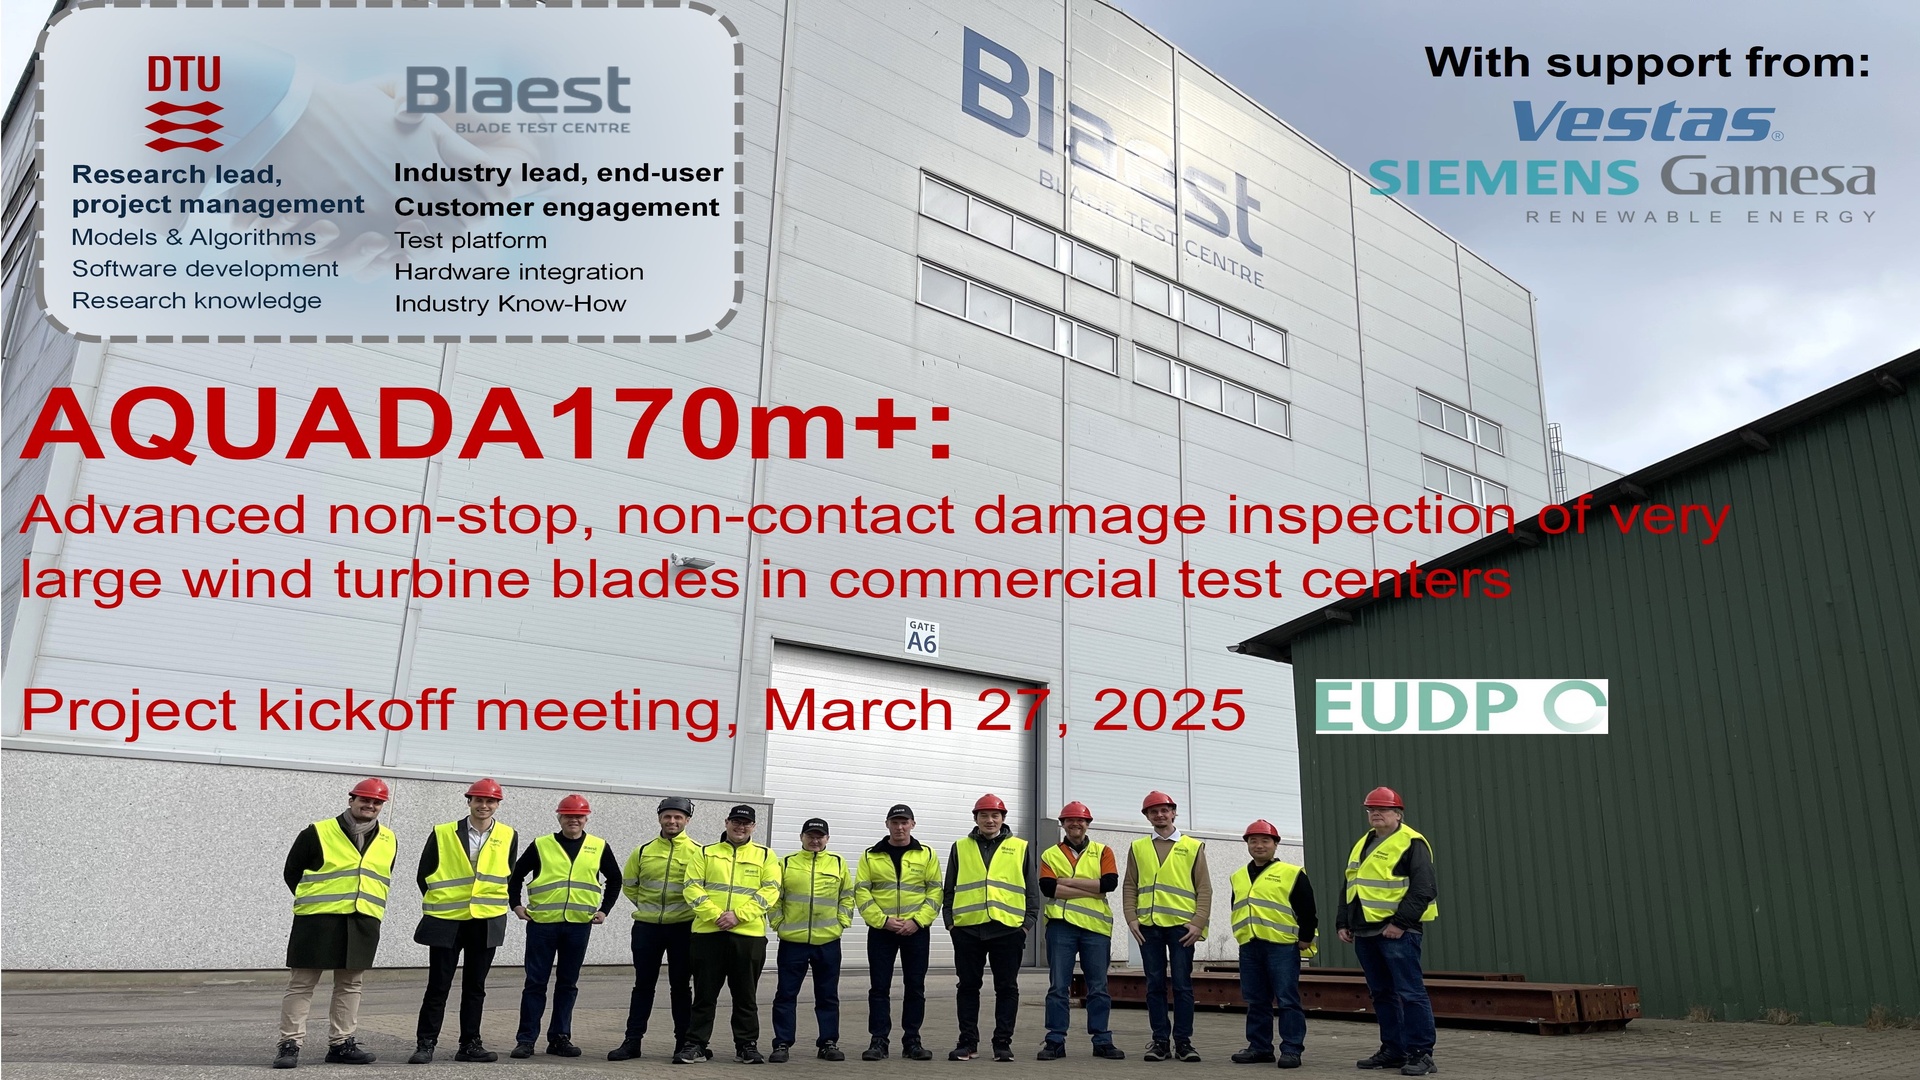
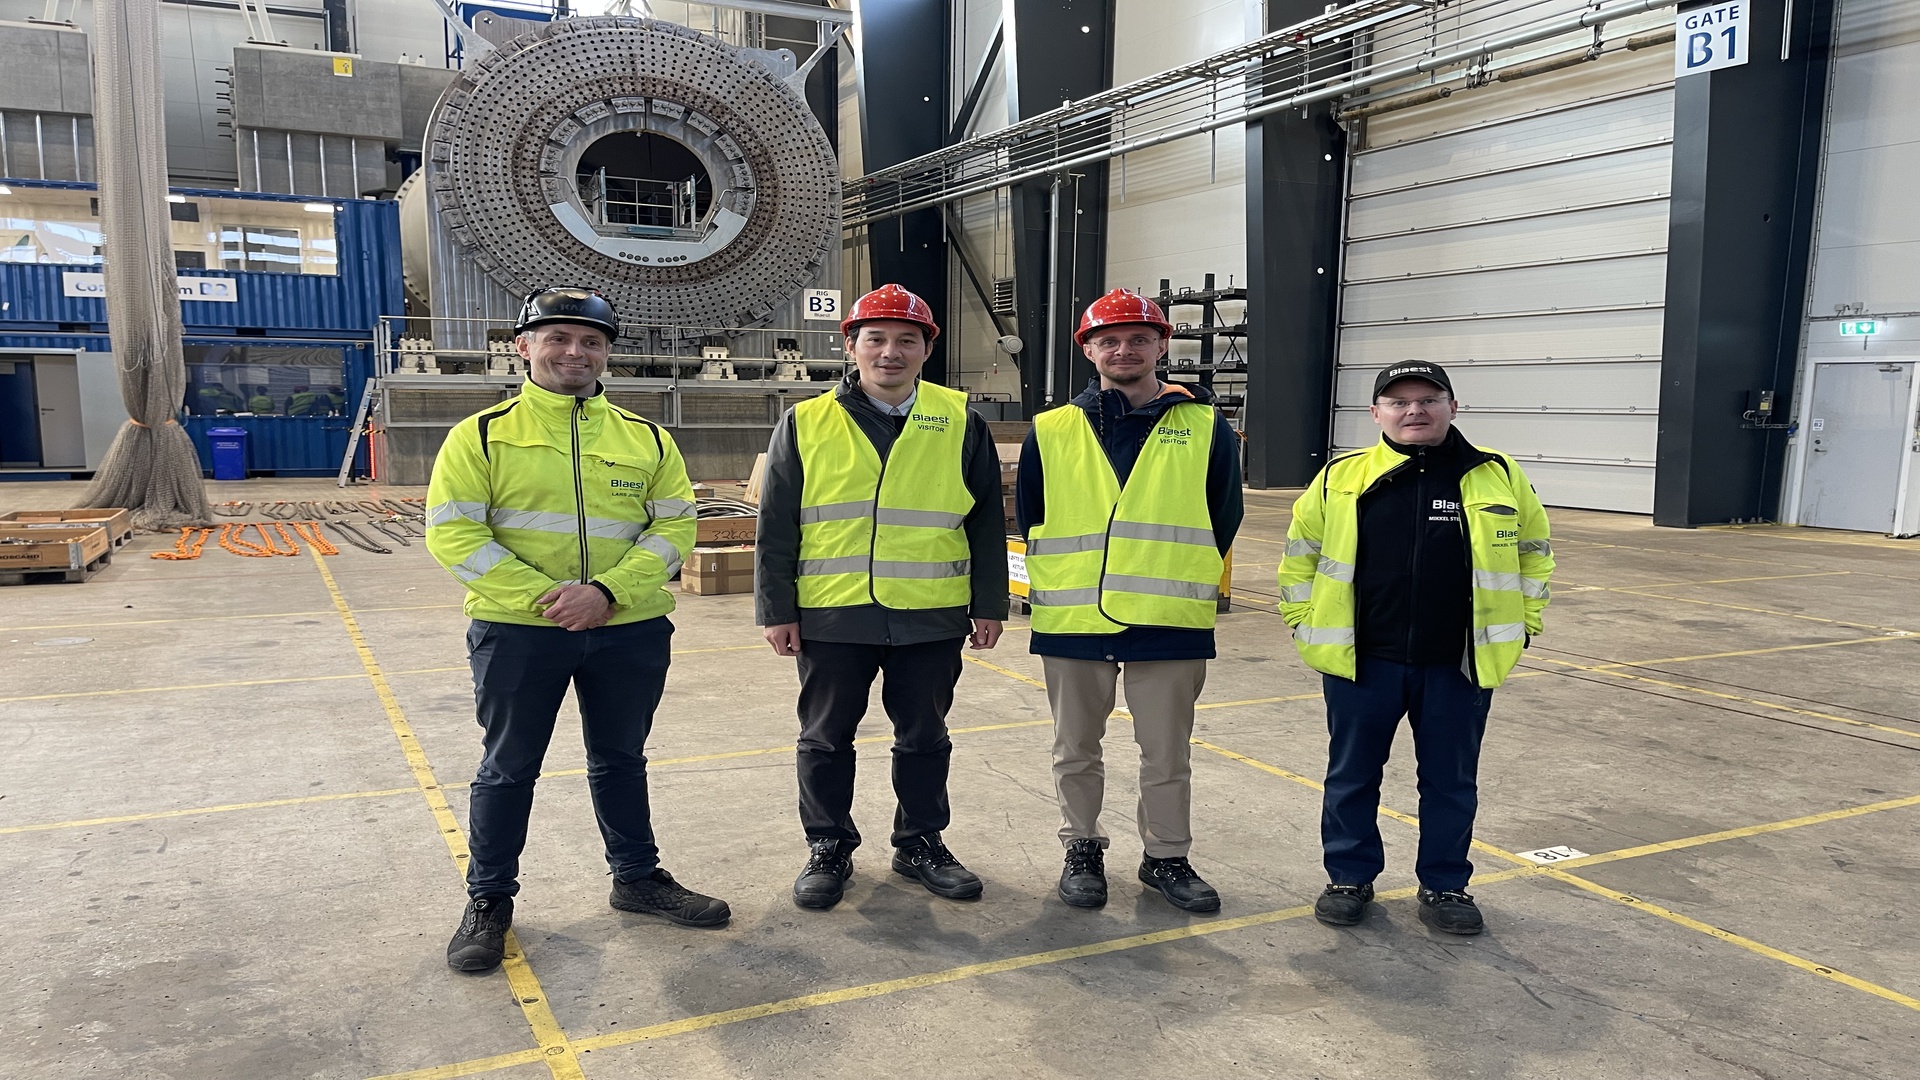
Project Kickoff meeting, March 2025
Project coordination meeting, January 2026
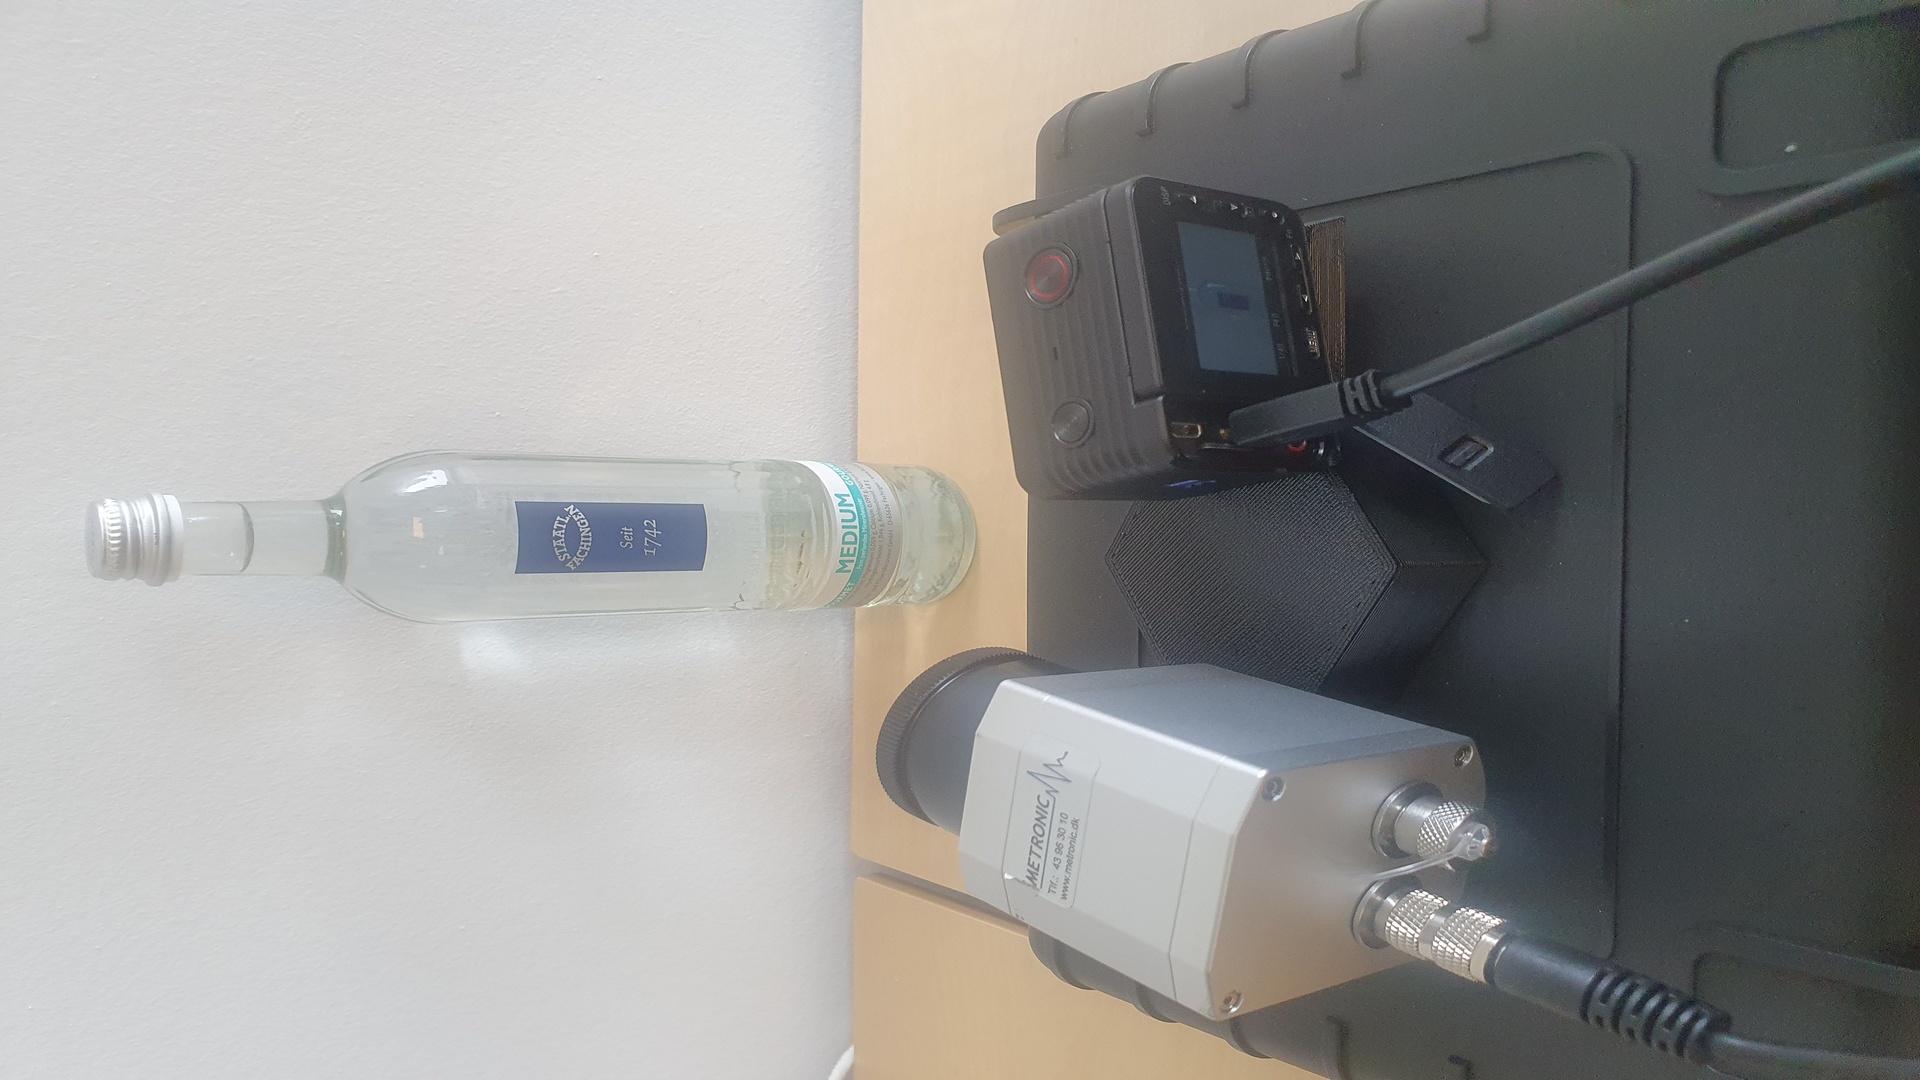
Early hardware solution development, April / May 2025
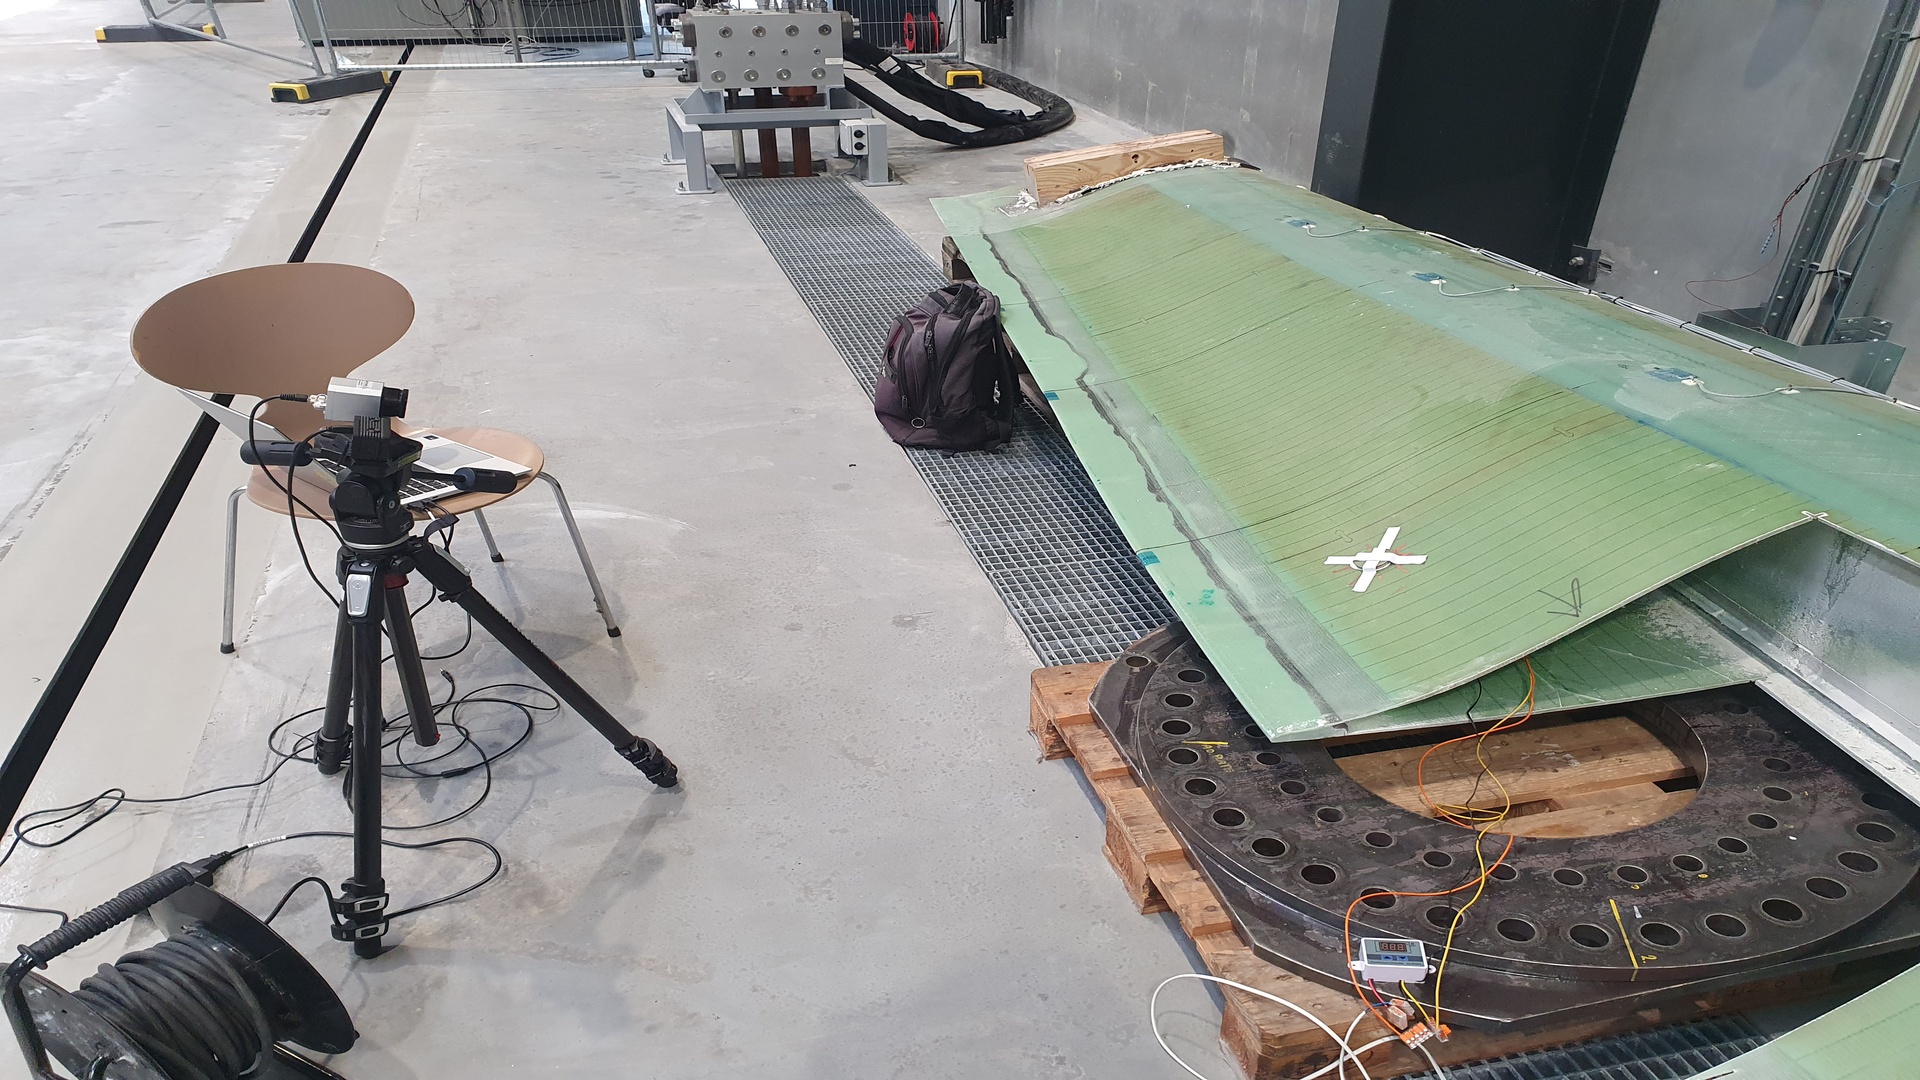
Methodology development at DTU, August / September 2025
Developed software
In 2025 DTU has developed wind turbine blade test investigation and monitoring software, designated as AQUADA 170m+ software. In its current version "v0.4", the AQUADA 170m+ software is an application designed to monitor and analyze the temperature variations of wind turbine blades over time. The software provides an intuitive user interface that allows researchers and engineers to create and configure thermal monitoring projects for camera-based data capture, followed by scientific analysis. Using both RGB and infrared (IR) cameras, the system captures thermal data at user-defined intervals, enabling detailed analysis of how wind turbine blade temperatures change during testing scenarios.
The software offers:
- Project Configuration: Set up monitoring projects with customizable start time, end time, and frame capture frequency.
- Region of Interest (ROI) Selection: Define a specific area of the blade for focused analysis.
- Reference Region: Establish baseline temperature measurements for comparative analysis.
- Real-time Temperature Monitoring: Generate average temperature variation plots during data capture.
- Thermal Visualization: Create contour plots to visualize temperature distribution patterns.
- Data Recording: Save both individual frames and continuous video recordings.
- Automated Reporting: Generate comprehensive final reports with analysis results.
- Project Recovery: Resume interrupted monitoring sessions.
AQUADA 170m+ Software version history
Contact Us
If you would like more information about the AQUADA 170m+ project or have specific questions, contact Xiao Chen:
Head of Section
Department of Wind Energy – DTU
Email: Contact